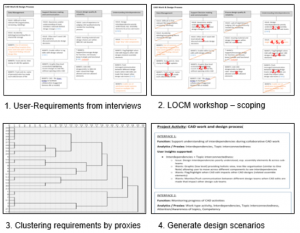
During this quarter our research efforts have been focused on four areas:
- Eliciting user needs for a Formula Student team project health monitoring dashboard and consolidation / grouping of analytical techniques (proxies) to meet FS user needs.
- Preparing industry-facing summaries of the proxies that we have developed.
- Creating a real-time skills and competency mapping dashboard with one of our industrial partners.
- The preparation of a joint research proposal with another of our industrial partners to exploit the findings and techniques developed in this project.
Formula Student Dashboards
On the first point, in order to understand how the Formula Student team could benefit from our project’s techniques, a series of user-interviews were conducted. Academic staff supervisors and student project managers from Universities of Bath, Bristol and UWE took part in semi-structured interviews. Interviews were coded using thematic analysis, which identified 85 unique user requirements. Further axial coding and affinity diagramming showed user insights focused on four core areas of activity within the project: 1) planning and monitoring project progress, 2) CAD based design process, 3) communication and team dynamics, and 4) team competencies.
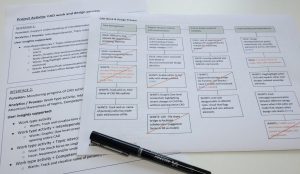
For each requirement, we discussed and agreed which were outside the scope of project management support and, in line with wider project aims, were not automatable. For the remaining 36 unique in-scope requirements, researchers tagged each with one or more of the nine developed proxies that could be applied to support that user-requirement. A hierarchical cluster analysis method was used to group user insights that could be addressed by similar sets of analytics/proxies. The outcome of this analysis was the generation 10 design scenarios. These design scenarios provide narrative descriptions which envision how users may interact with a dashboard. They both enable researchers to anchor envisioned proxy applications to the users’ requirements, work practices and context; and also provided a clear and simple means to support communication with users in the evaluation and the iterative design process of creating dashboards tailored to support Formula Student:


